
(There are some suggestions above.)
Small memories can be made fast but big memories will be slower. In practice, some memory locations are used more often than others. To maximise performance we want the frequently used locations to be fast and if the infrequently used locations are slow it won't have a too-serious impact. The approach relies on the statistics of a ‘typical’ program ... whatever that may mean.
Fortunately, almost all software shares certain characteristics which can be loosely described by the Pareto principle in that most of the memory access is limited to a small subset of the total range. Whether that is 80% of references are to 20% of locations or 90% to 10% or whatever doesn't exactly matter and will vary from application to application.
Illustrations of this principle include:
A key word here (as we expect you already know) is “locality”. This comes in two (main) ‘flavours’:
Puzzle: considering your knowledge of software behaviour, what examples of locality can you think of?
(There are some suggestions above.)
This principle is the basis of cacheing in a memory hierarchy. The organisation can be done ‘by hand’ (i.e. by a programmer knowing specific addresses for differing speed/size memory areas) but is usually automated with an algorithm deciding dynamically which items from the memory should be accelerated.
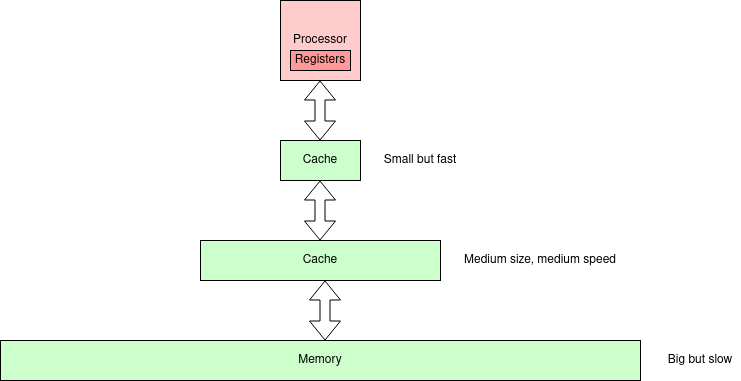
It's traditional to have something like the next picture about here.
There are
bigger
pictures with more levels but the principle holds. In this figure
there are two levels of cache. In practice there may be more
levels.
Note that cache duplicates some part(s) of the memory below it
in the hierarchy. Its function is to (try to) improve performance; it
is not essential for correct function.
Another ‘tradition’ at this stage is to look at some performance figures and calculations. These are also good for asking test questions about, so here goes.
Assume the time taken for a cache access is the same as a processor cycle. Let the memory take Tmem cycles. If the probability of a cache miss is Pmiss the average memory access time will be:
Tave = 1 + Pmiss×Tmem
For example, if Tmem = 10 and
Pmiss = 10% the average time per access would be
2 cycles.
Notice this would mean the processor running at half the speed it is
capable of.
Note that the miss rate is more commonly quoted than (its complement) the hit rate since hit rates are usually quite high and numbers like 99.8% and 99.9% are harder for readers to differentiate than 0.2% and 0.1%.
Easy puzzle: if the miss rate in the above example is reduced to 5%, what would the average instruction cycle time be?
Activity: experiment with plotting some curves from the range of typical cache values below.
Notice how easily the system performance can be ‘crippled’ by the memory speeds! A low miss rate is therefore very important. The ‘memory speed’ may also be alleviated with more cache levels.
Puzzle: given Tmem = 10 what miss rate (Pmiss) would be needed to achieve a 10% performance penalty?
Discussion: in some literature you may see a variant formula: Tave = (1 - Pmiss) + Pmiss×Tmem
which removes the ‘wasted’ (failed) hit attempts. However something needs to determine each hit/miss status.
One strategy would be to start both a cache and memory access immediately and abandon the memory reference if the cache hits. What are the pros and cons of this approach?
The formula above can be extended to multi-level caches.
Tave = 1 + PmissL1×(TL2+ PmissL2×Tmem)
(And so on.)
Discussion: what, if anything, can be done whilst waiting for a response from a cache miss?
We return to this topic later but this is an opportunity to think what (if anything) might be practicable in these circumstances.Note that there is a potential analogy in a virtual memory system page fault – with the inherent latency of swapping a page from a disk. How similar (or different) is this case?
Next: Caches.